

Key Performance Indicators
#2.15 — Looking at some key basic metrics for this season. Early days. It could be worse. It will need to be better.

This is an idea I got from the excellent Arsenal substack Canon Stats. The idea is to look at some key metrics at regular intervals in the season and see what we can learn.
Some metrics define outcomes, and others seek to quantify the quality of the process. I have had a look at some basic but key metrics.

The season is early, so this is mainly a descriptive process with a bit of evaluation but limited analysis. I am describing what is happening and whether I like it, not why it is happening.
I have compared this season to the last two (2023-24 and 2024-25) —Jürgen Klopp’s last and Arne Slot’s first. A couple of reasons:
(1) There is a continuity of players from Klopp to Slot (the “Liverpool 2.0”). The current team cycle began in 2023-24, in my mind, with the major midfield rebuild.
(2) To compare Klopp and Slot.
I have also only included Premier League data for consistency.
If you notice anything I have not included, I would love to hear about it.
I. Outcomes
I expect these results to be noisy due to two factors: (1) the dead rubbers at the end of last season, and (2) the fact that this season is still young.
Nevertheless, it still tells us (1) where things are now, and (2) provides a point of comparison for when the season is older.
Points
Here are Liverpool’s Points Per Game season averages (yellow) and continuous 10-Match Rolling Mean (red):
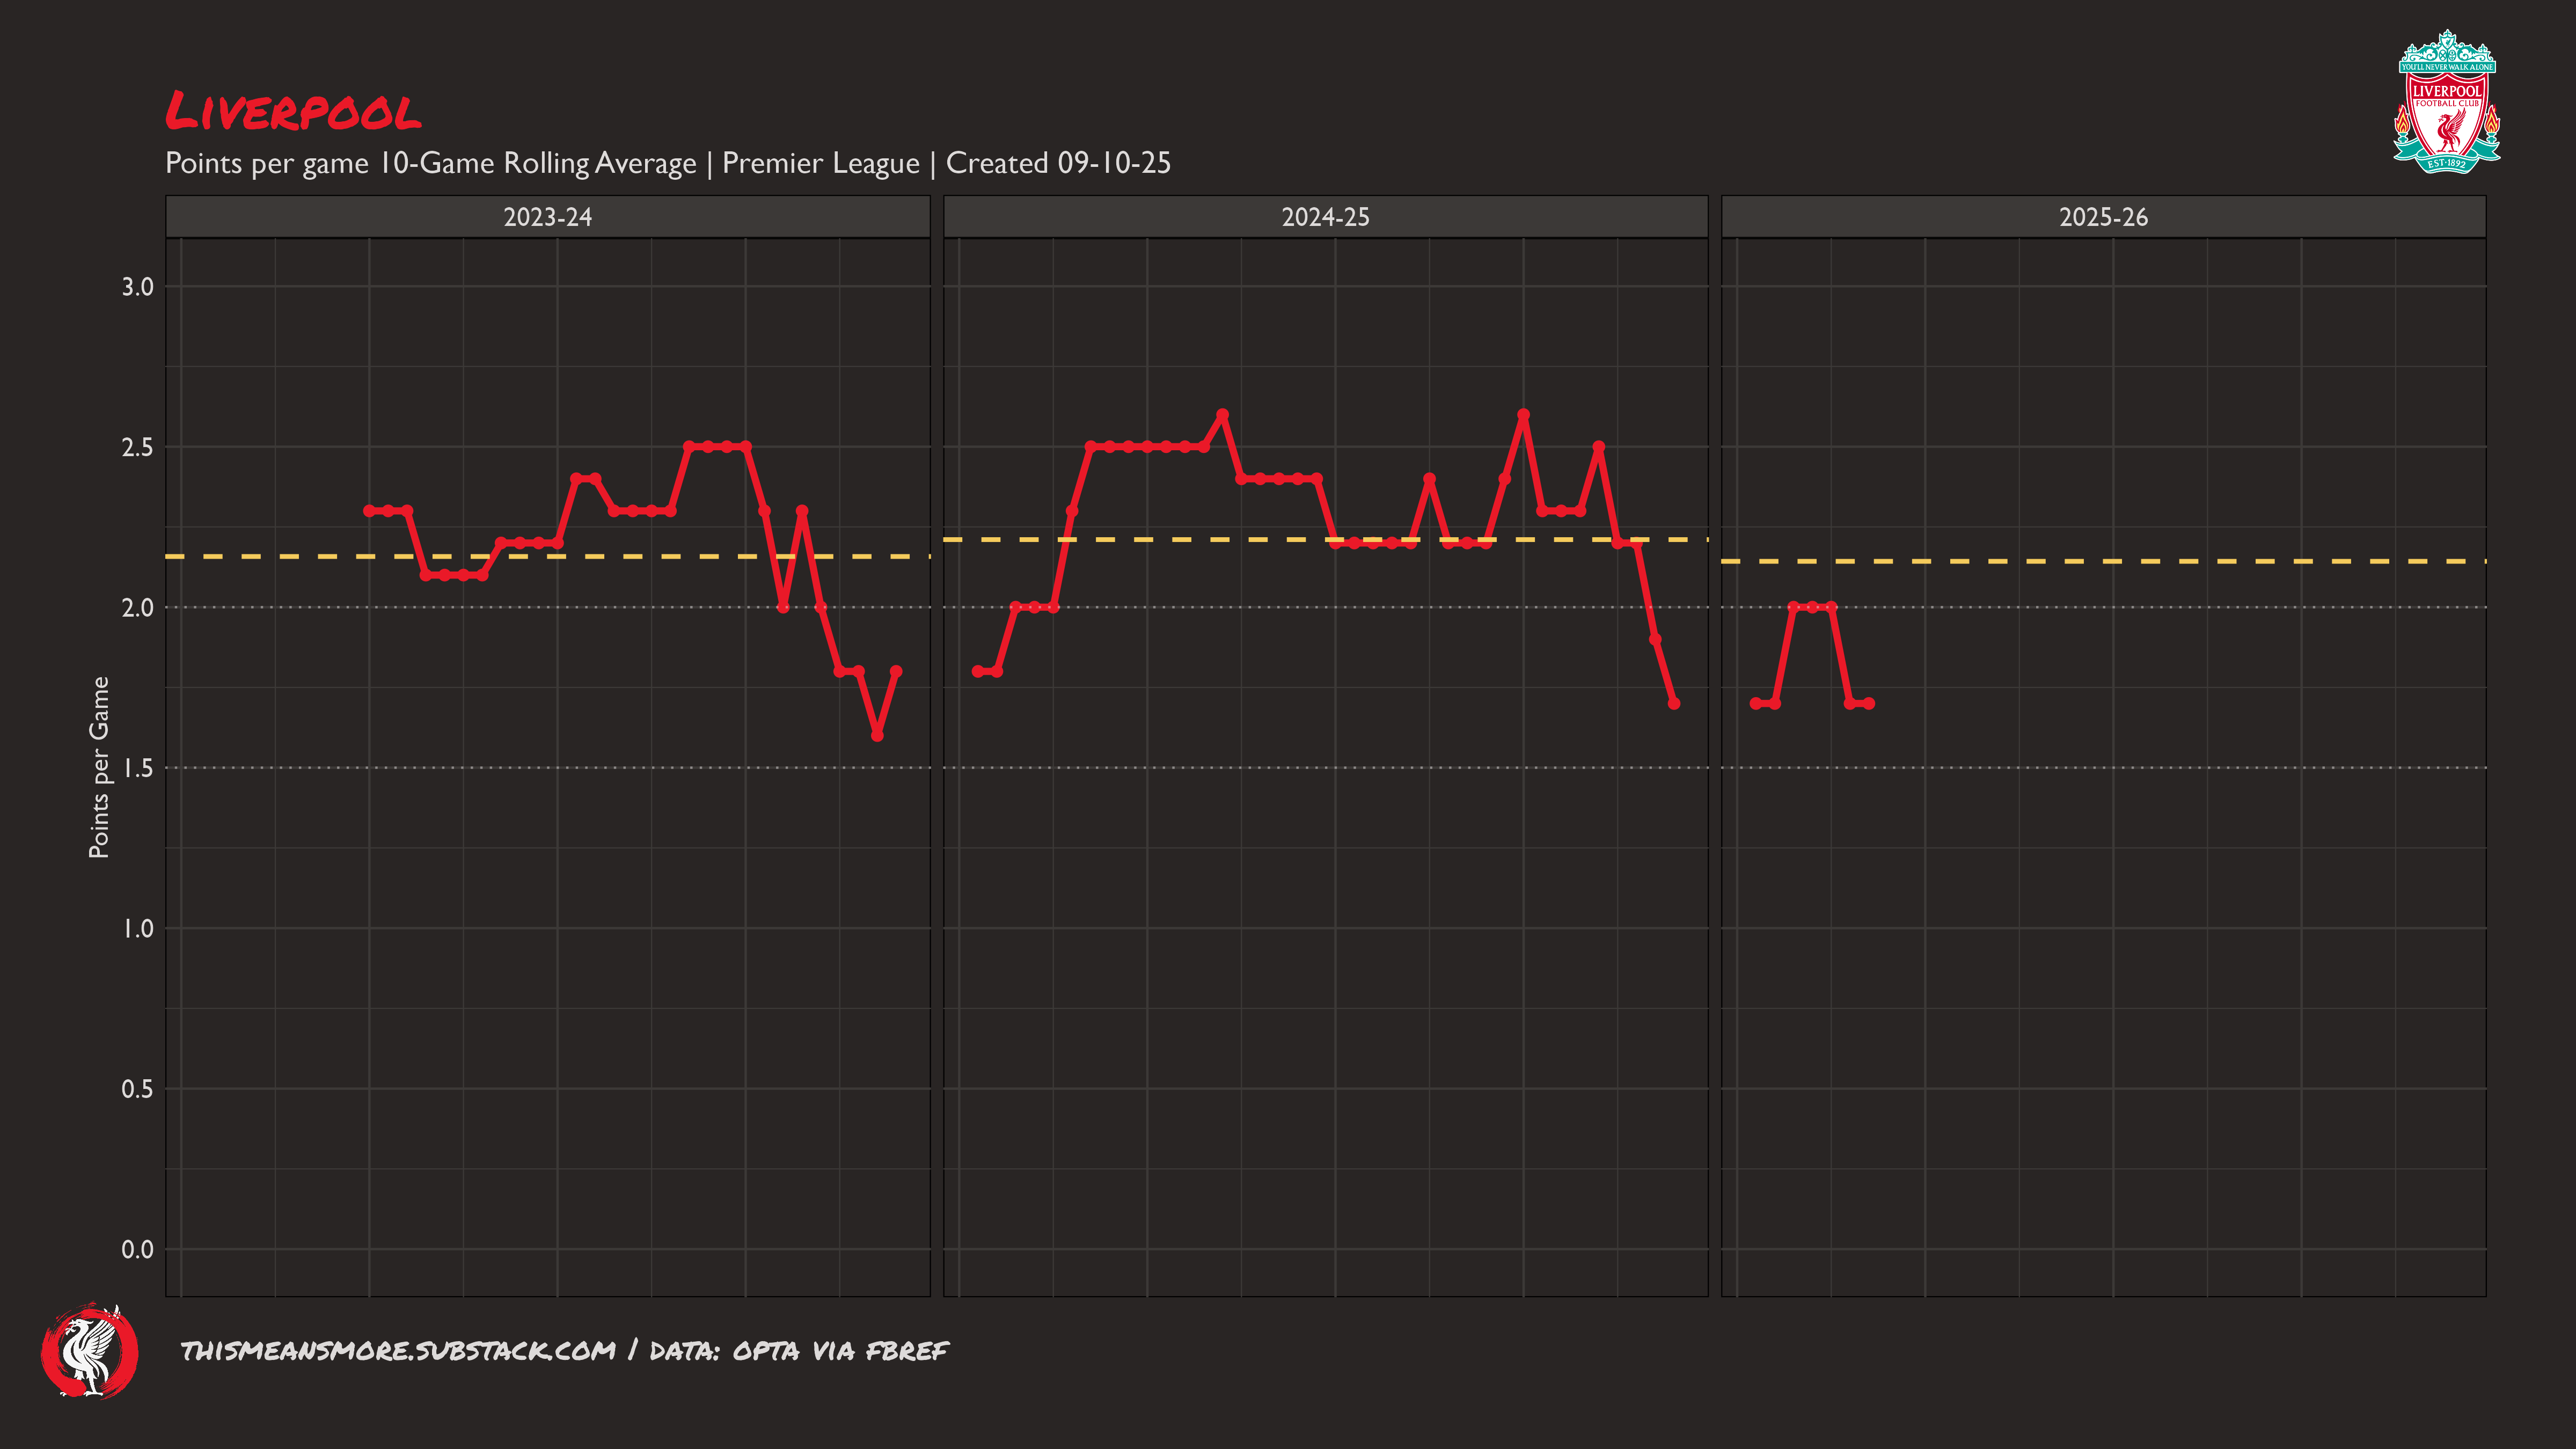
Liverpool’s points per game is only slightly lower than last season. Two (three, including Champions League) consecutive losses feel bad, but these results are not as terrible as they feel. Especially when considering the toughness of the schedule.
They have done incredibly well to get these points from these fixtures whilst struggling to play that well. (See Underlying Data below).
The (red) rolling average tells a nice visual story of the last three seasons. A good season that fell away in Jürgen’s last dance, Slot picking them up and keeping them at champion level, tailing off when the league was won, and now struggling to get back to title-form.
The current rolling average is impacted by the party time at the end of last season, so has Liverpool in the 1.5-2.0 range, which makes them a top-four team rather than a title challenger on current form.
I expect this to improve, because it definitely needs to. But this is not a crisis.
Goal Difference
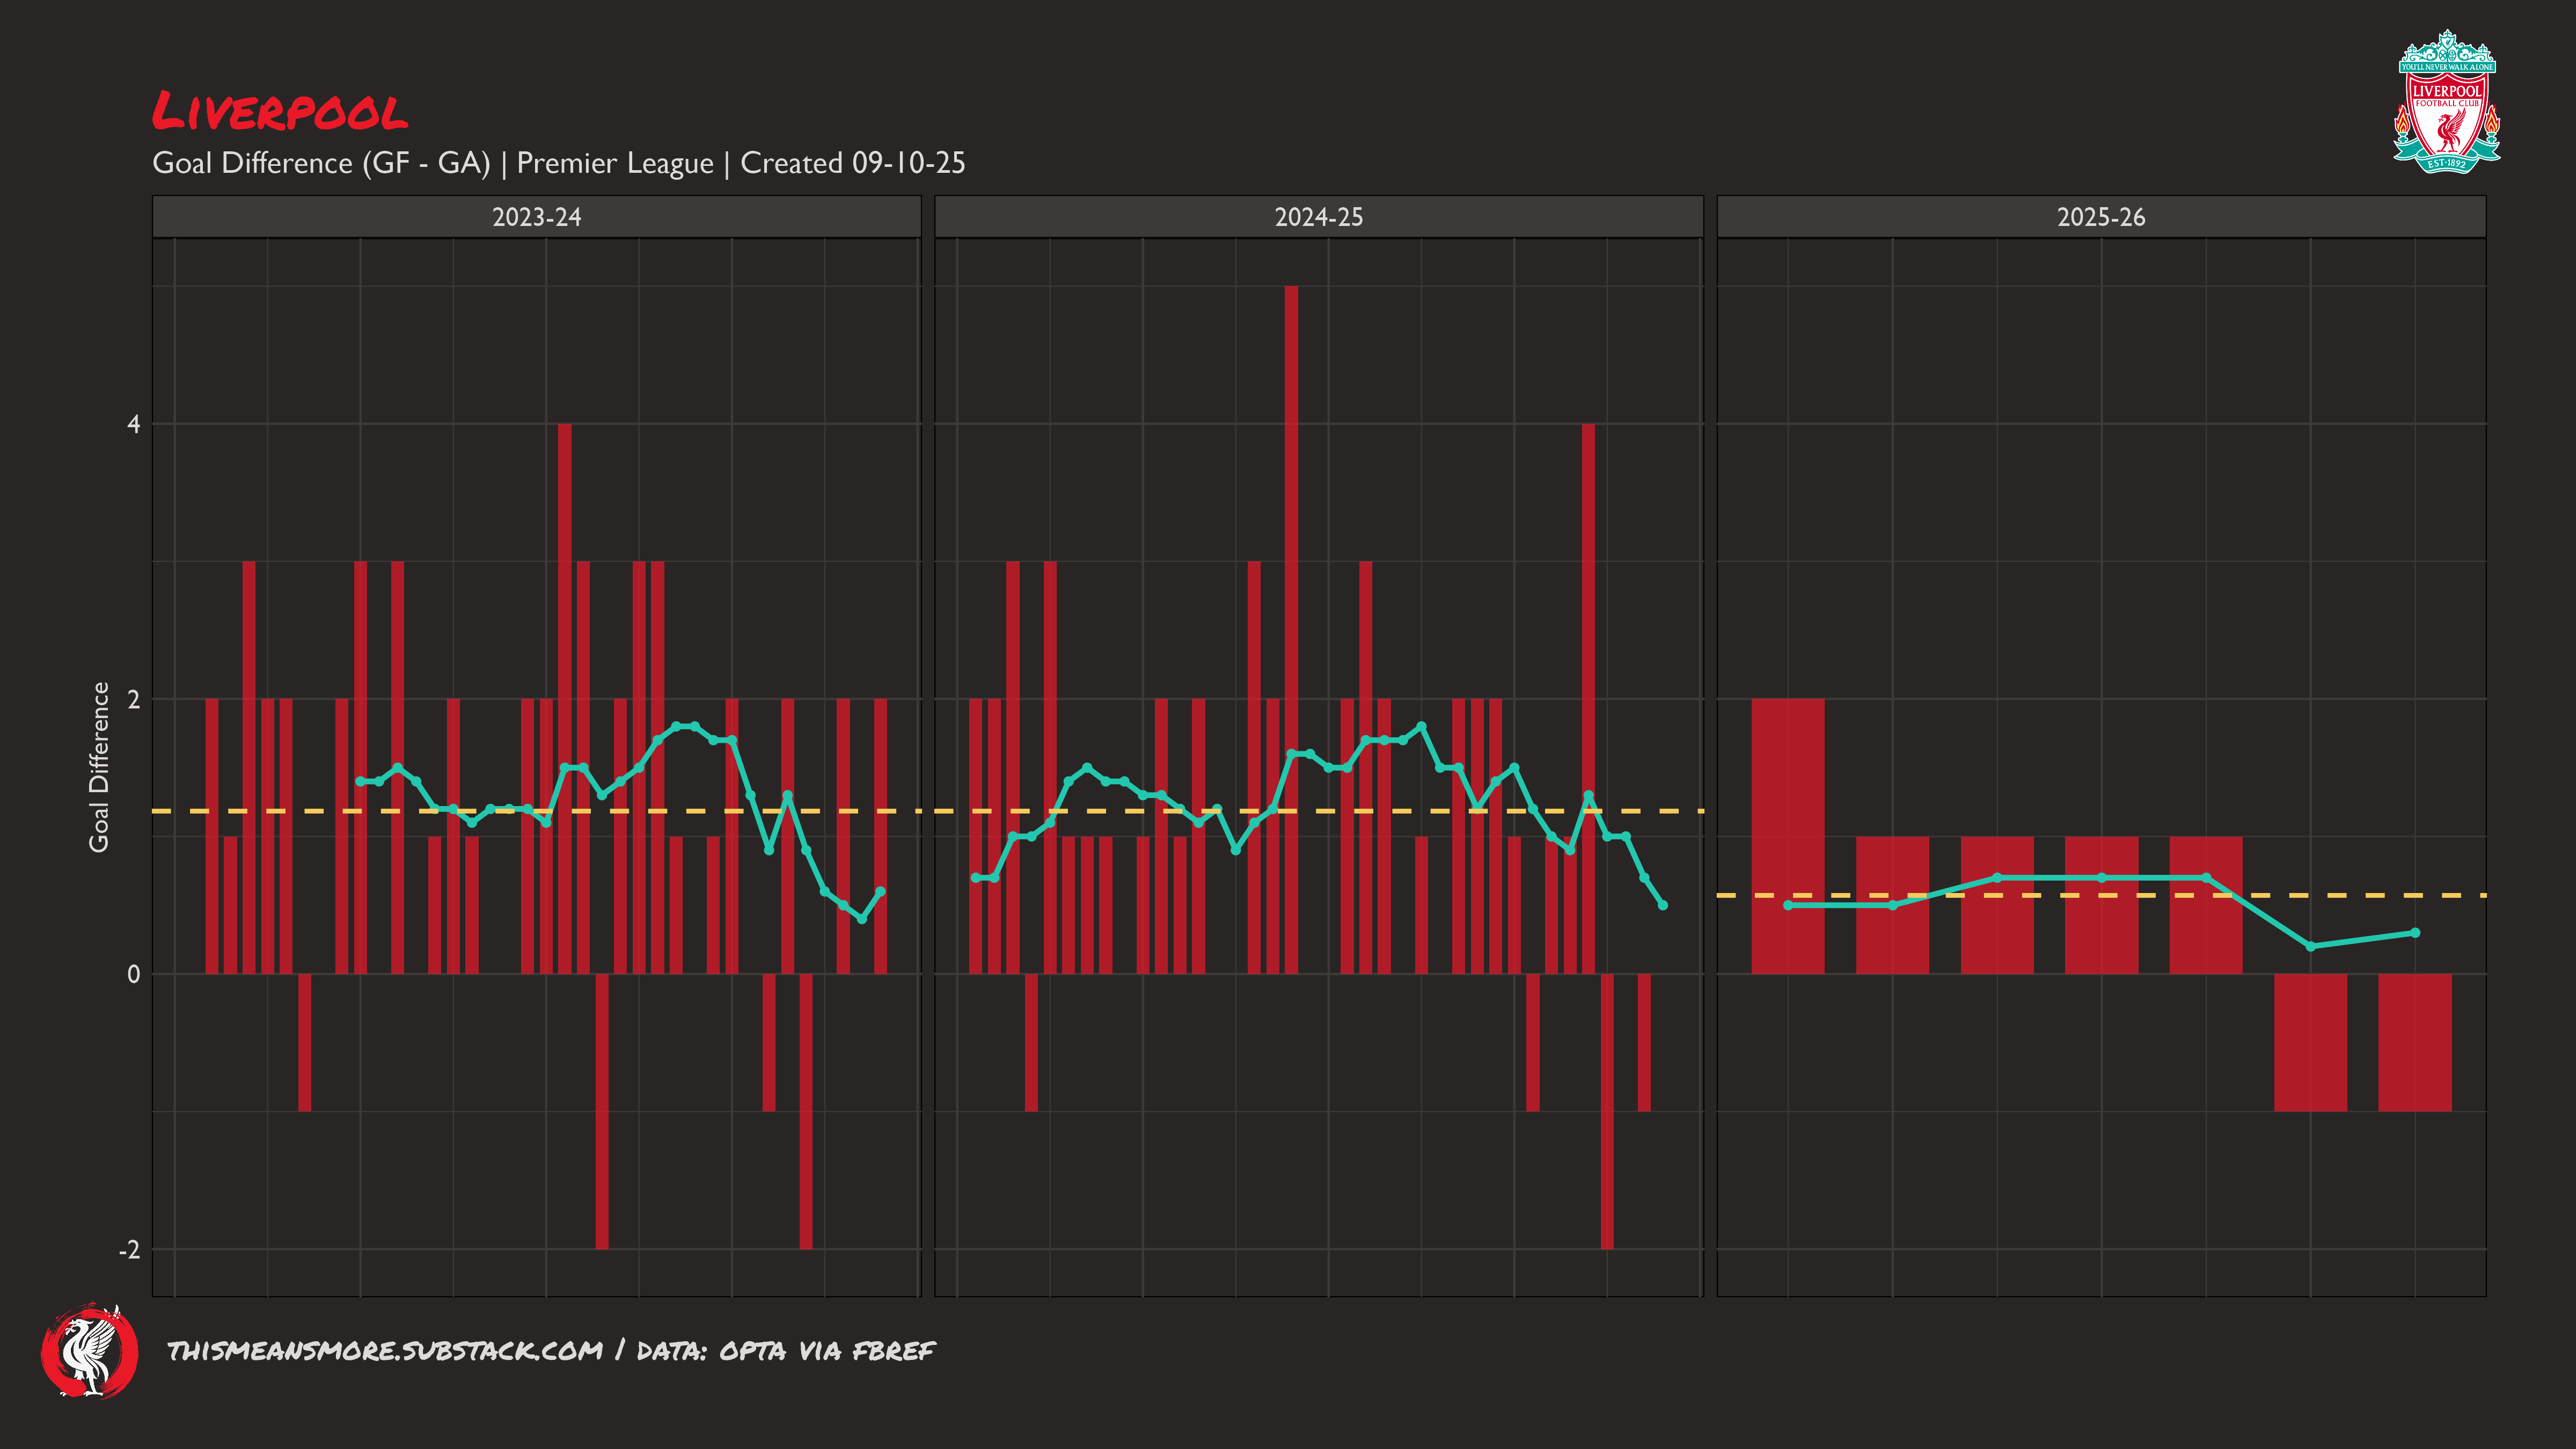
Season mean (GD/90): 0.57
10-match rolling mean: 0.3
This does not reveal a great deal at this stage, beyond the fact that things need to improve. We will need to examine the underlying numbers to determine whether attacking or defending is the primary issue.
II. Process
Expected Goals
I am having lots of thoughts about xG at the moment. Basically, I think it is very easy to use and interpret it badly.
Nevertheless, I think it has some utility for assessing the quality of attacking process/chance creation over time. So, fwiw, here is the data for where Liverpool are with xG at the moment.
xG For
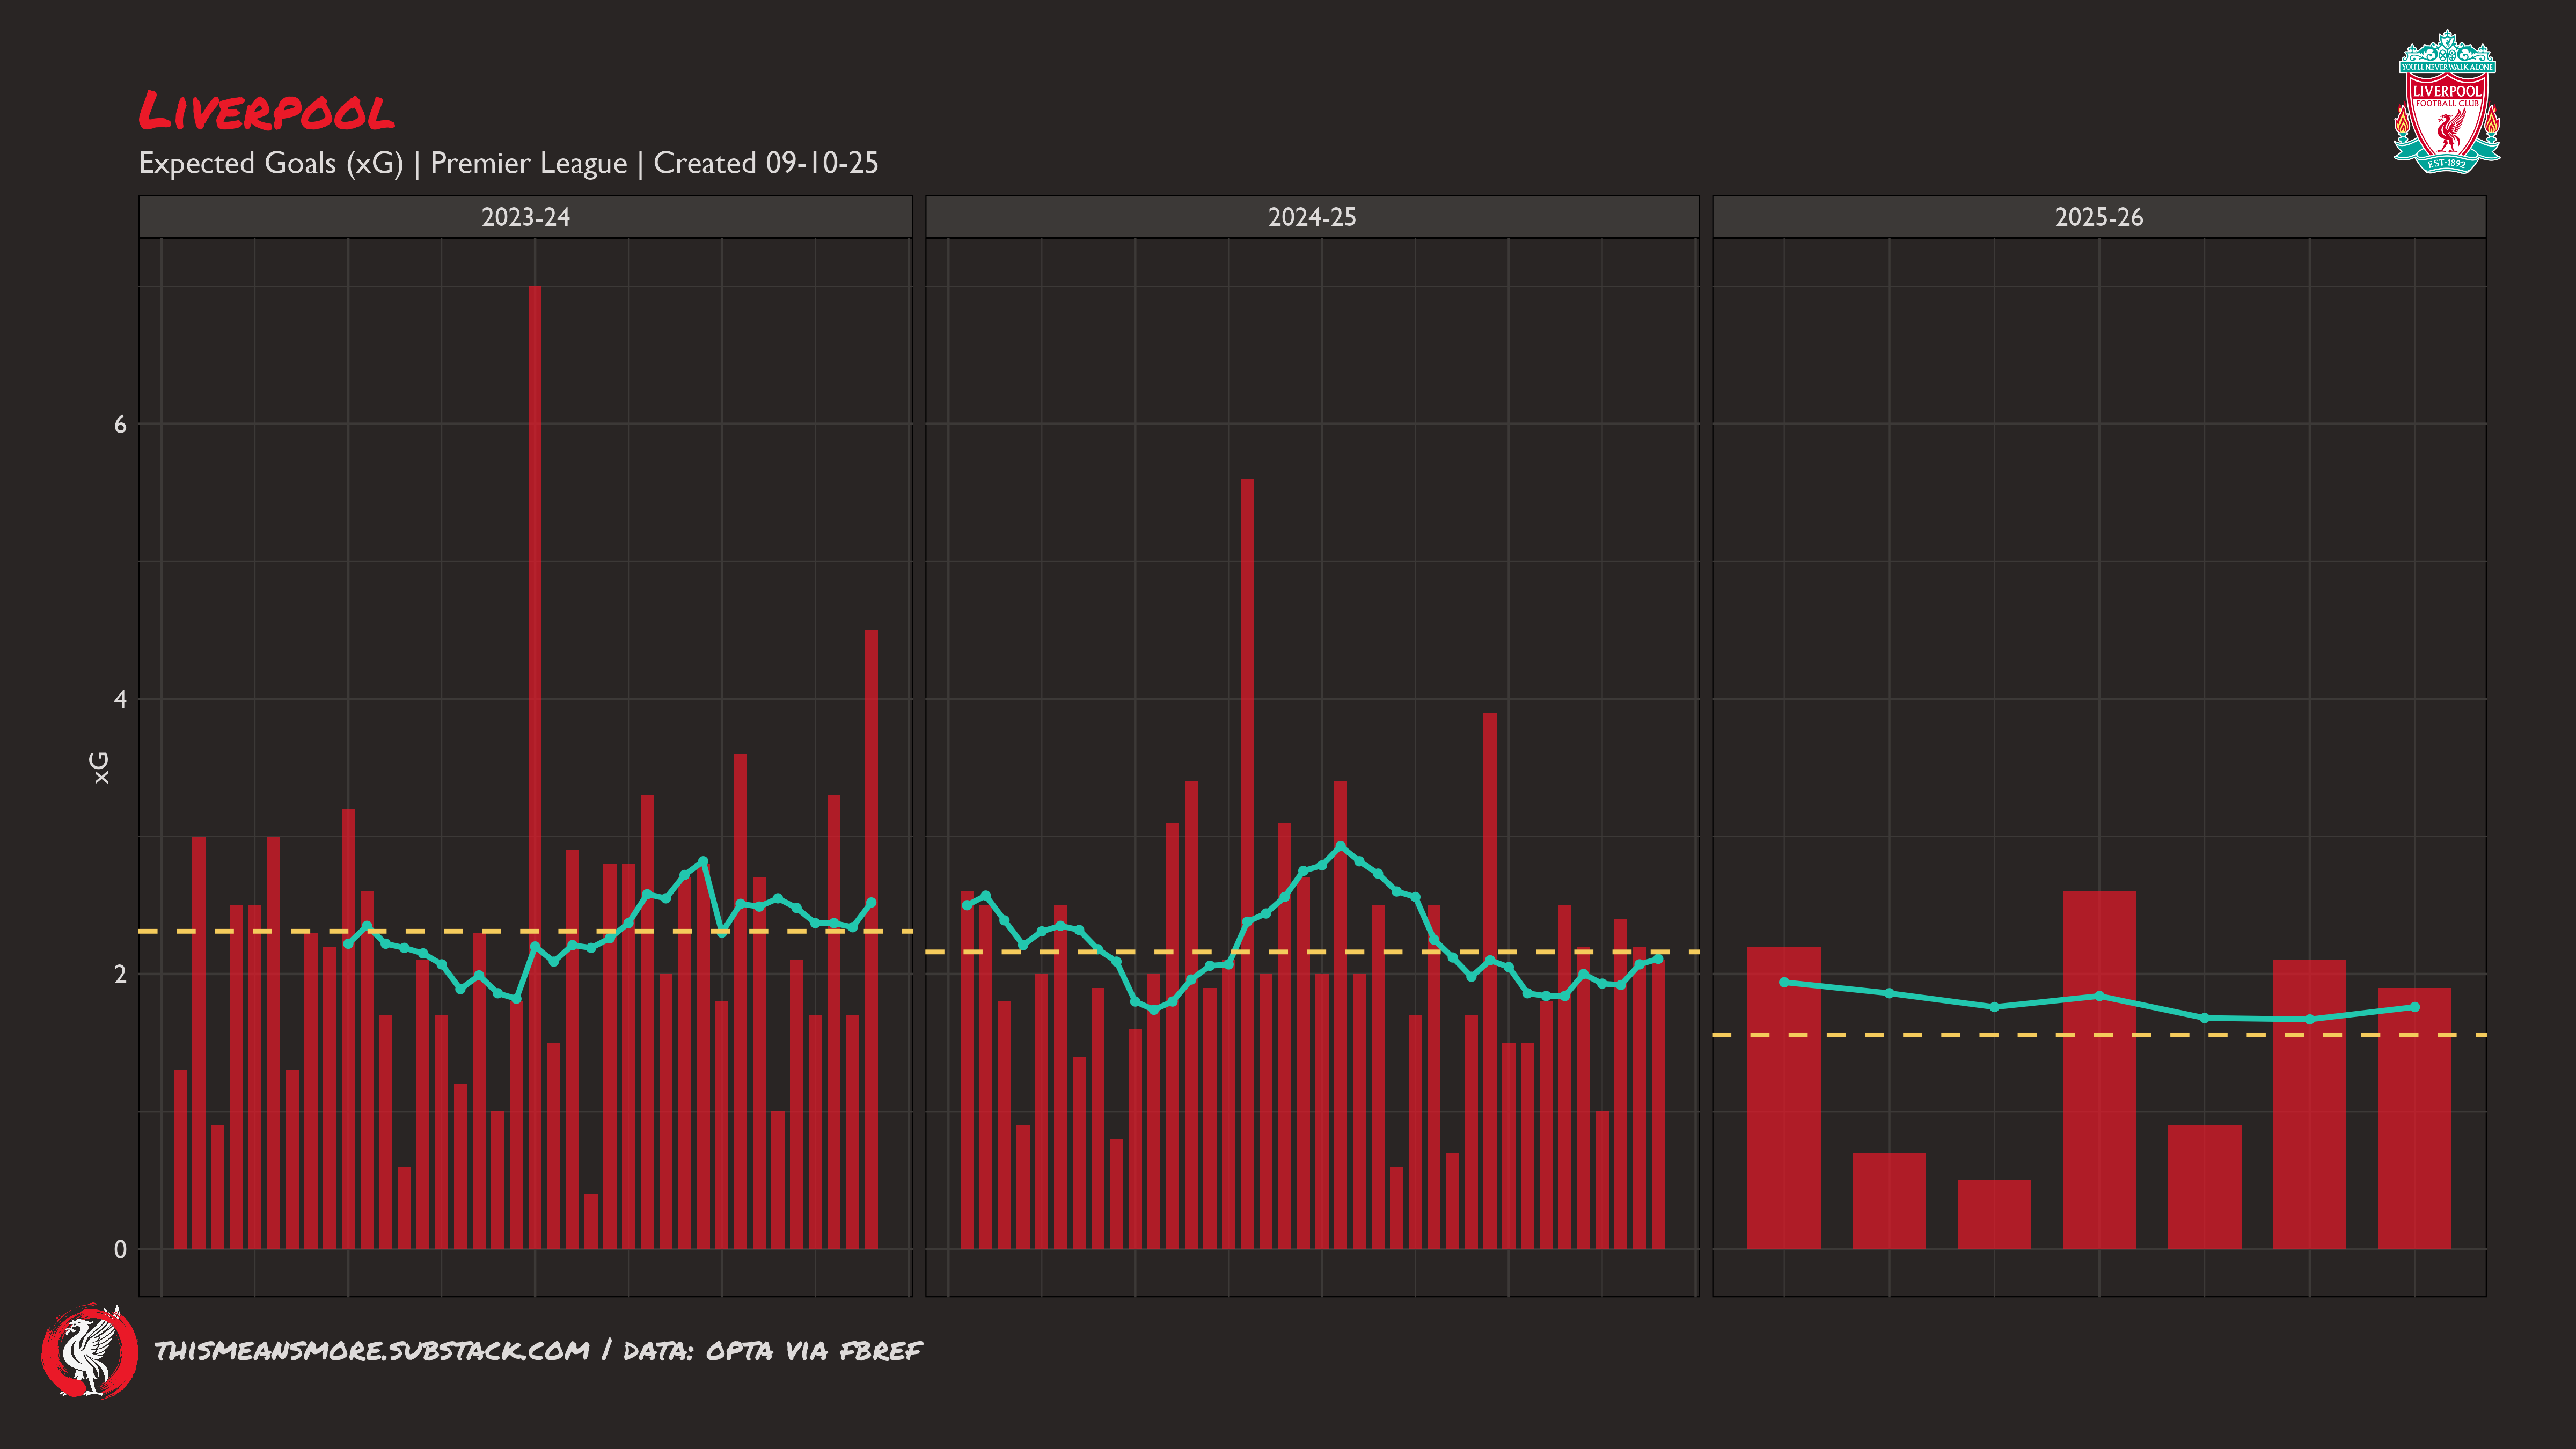
Season mean: 1.56
10-match rolling mean: 1.76
League mean: 1.27
A target season average of 2.0 xG/90 seems to me a reasonable expectation for an elite team (last season’s title-winning form was 2.16) — so Liverpool are currently well below target. With the season so young, I think a good amount of this will be due to fixtures, of which Liverpool have had difficult ones. This is also essentially a brand-new attack that is still to get up to speed.
No team is above 2.0 xG/90 in the Premier League yet. This might reflect how competent teams are out of possession now. Liverpool are 6th on this metric behind Manchester United, Crystal Palace, Manchester City, the Arsenal, and Brighton & Hove Albion.
Not terrible, but below where we want them to be.
The quantity of xG does not necessarily mean there is quality in xG. So it is worth interpreting this data in light of the shot data below.
xG Against
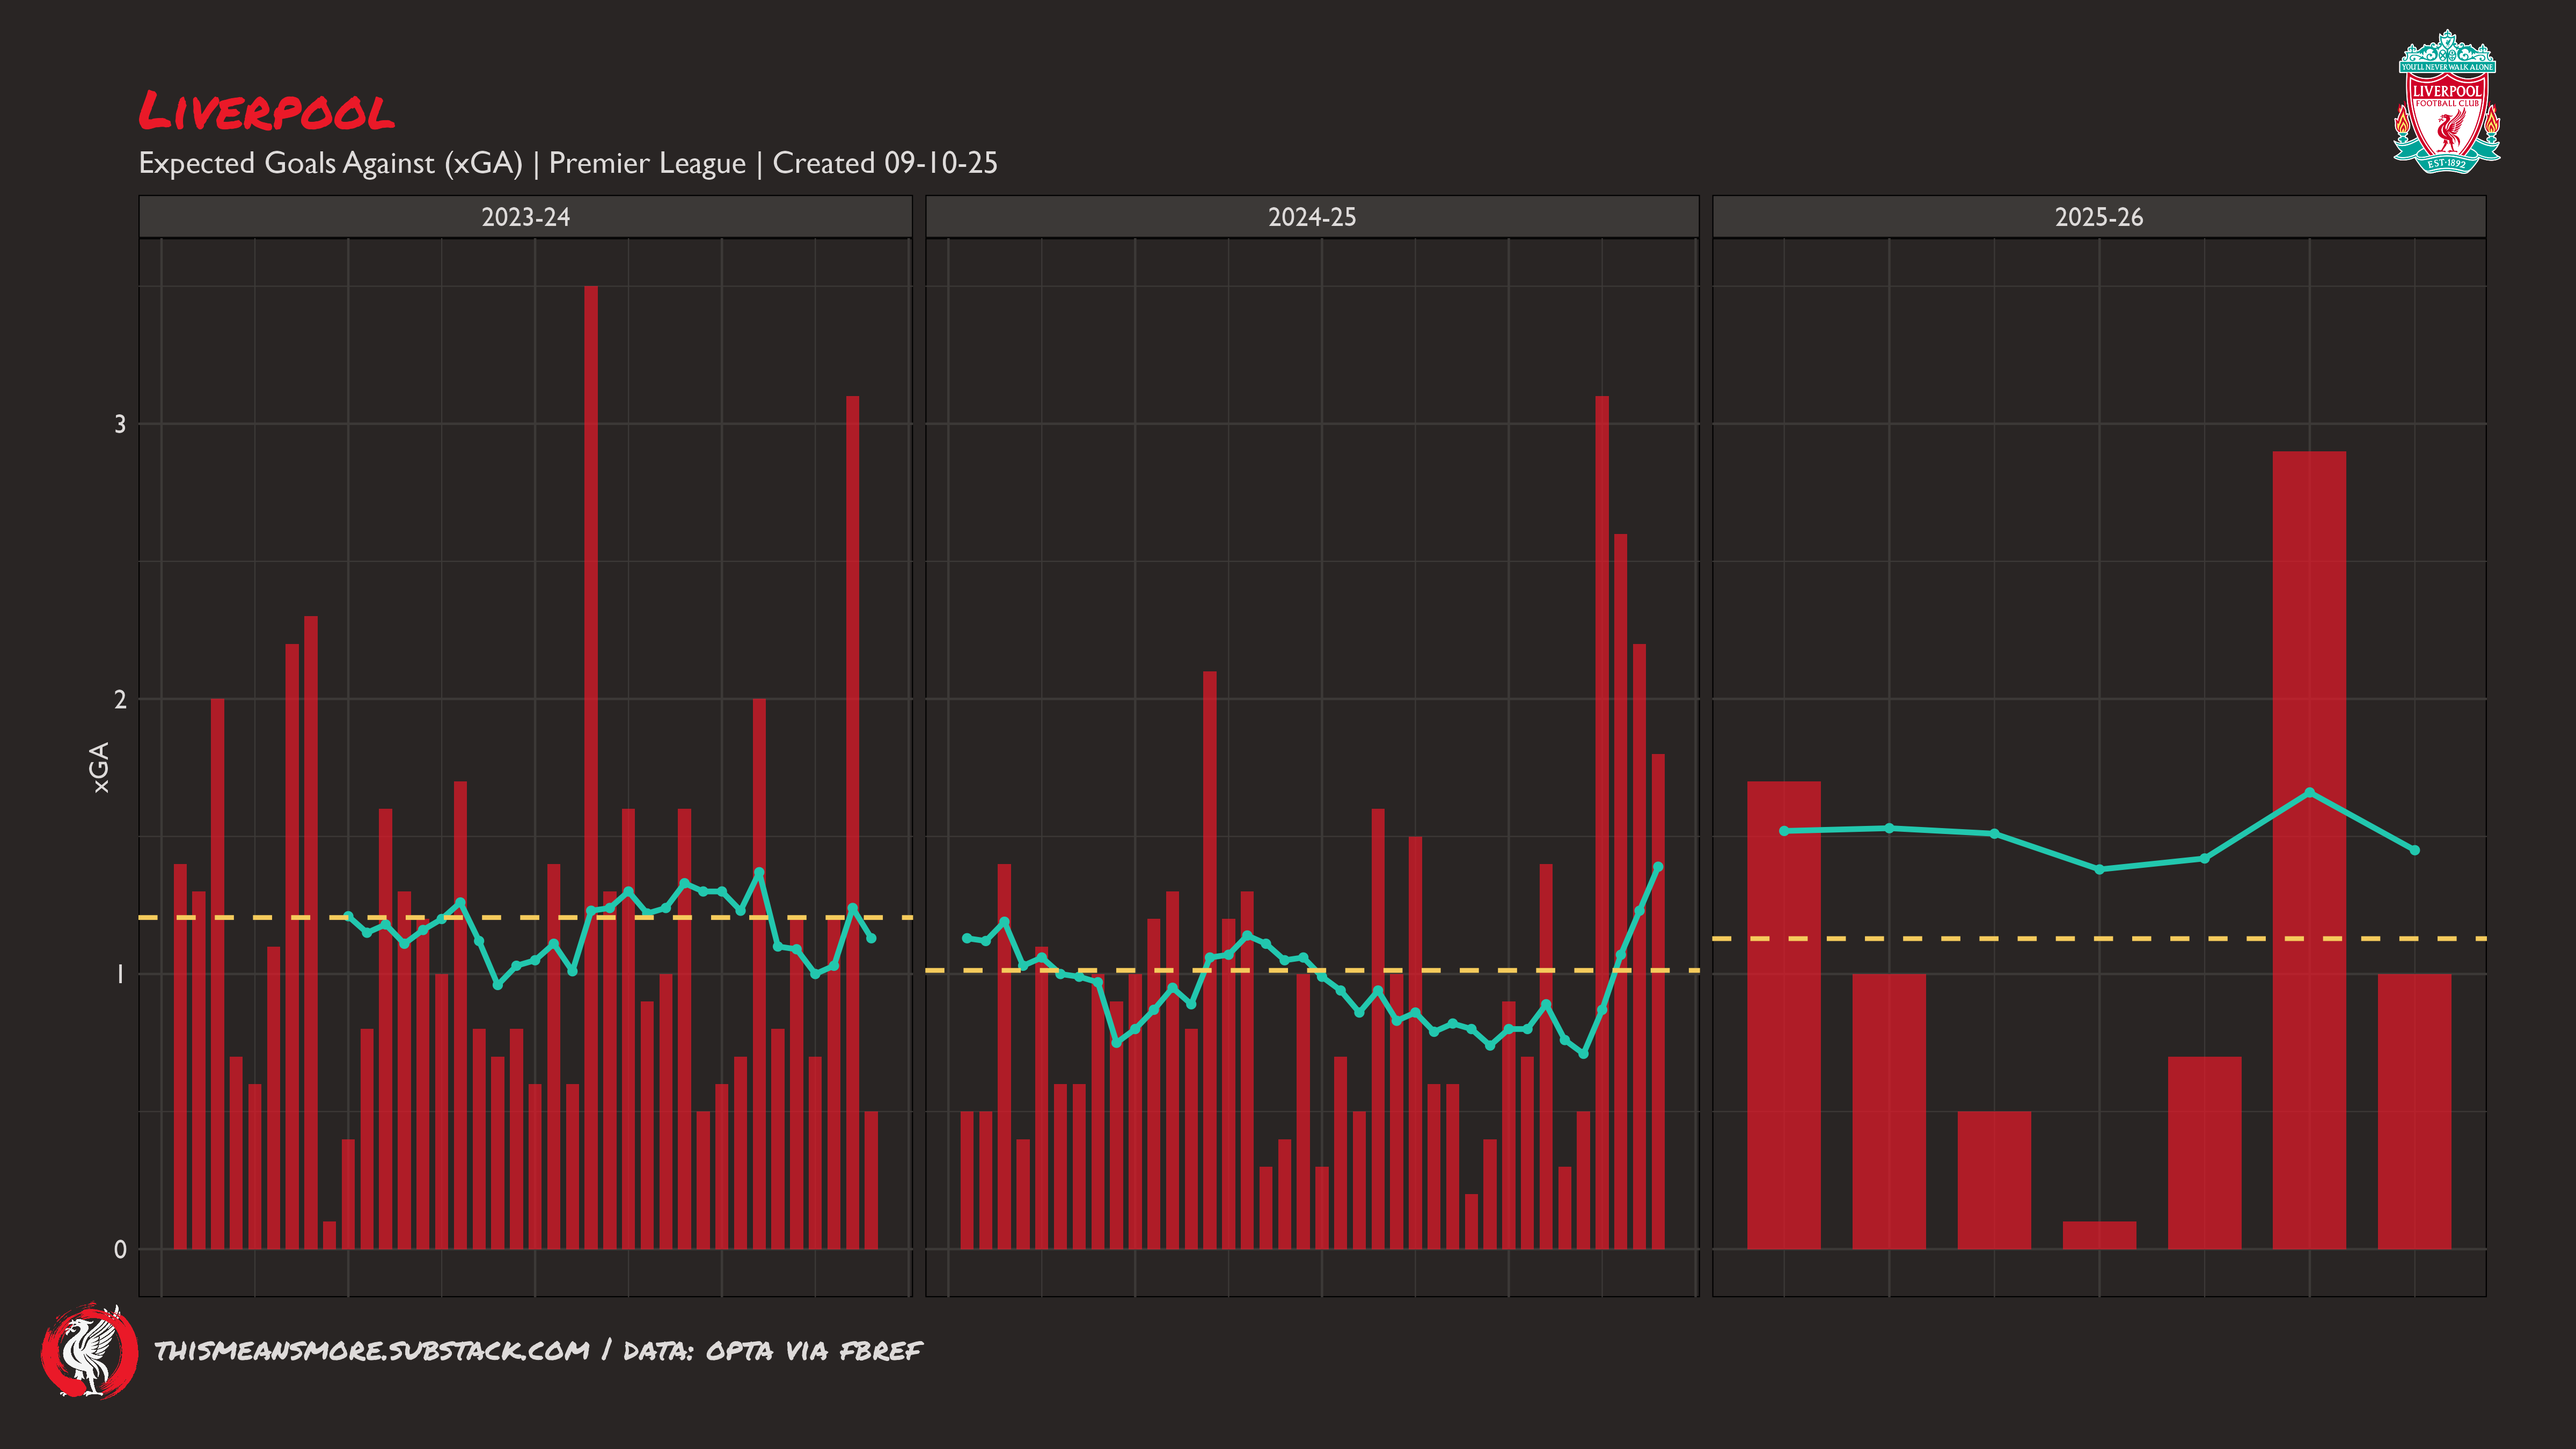
Season mean: 1.13
10-match rolling mean: 1.45
League mean: 1.26
The dead rubbers at the end of last season skew the rolling mean a lot, so I would not read much into it. Liverpool’s mean so far this season is a little higher this season, but it seems to be largely due to Bournemouth (h) and Crystal Palace (a). These two games aside, I do not see any indication of major issues here.
Liverpool are fifth in the league for xGA/90 behind the Arsenal, Newcastle United, AFC Bournemouth and Manchester City.
It could be better, but improving xG would be my priority.
xGdiff
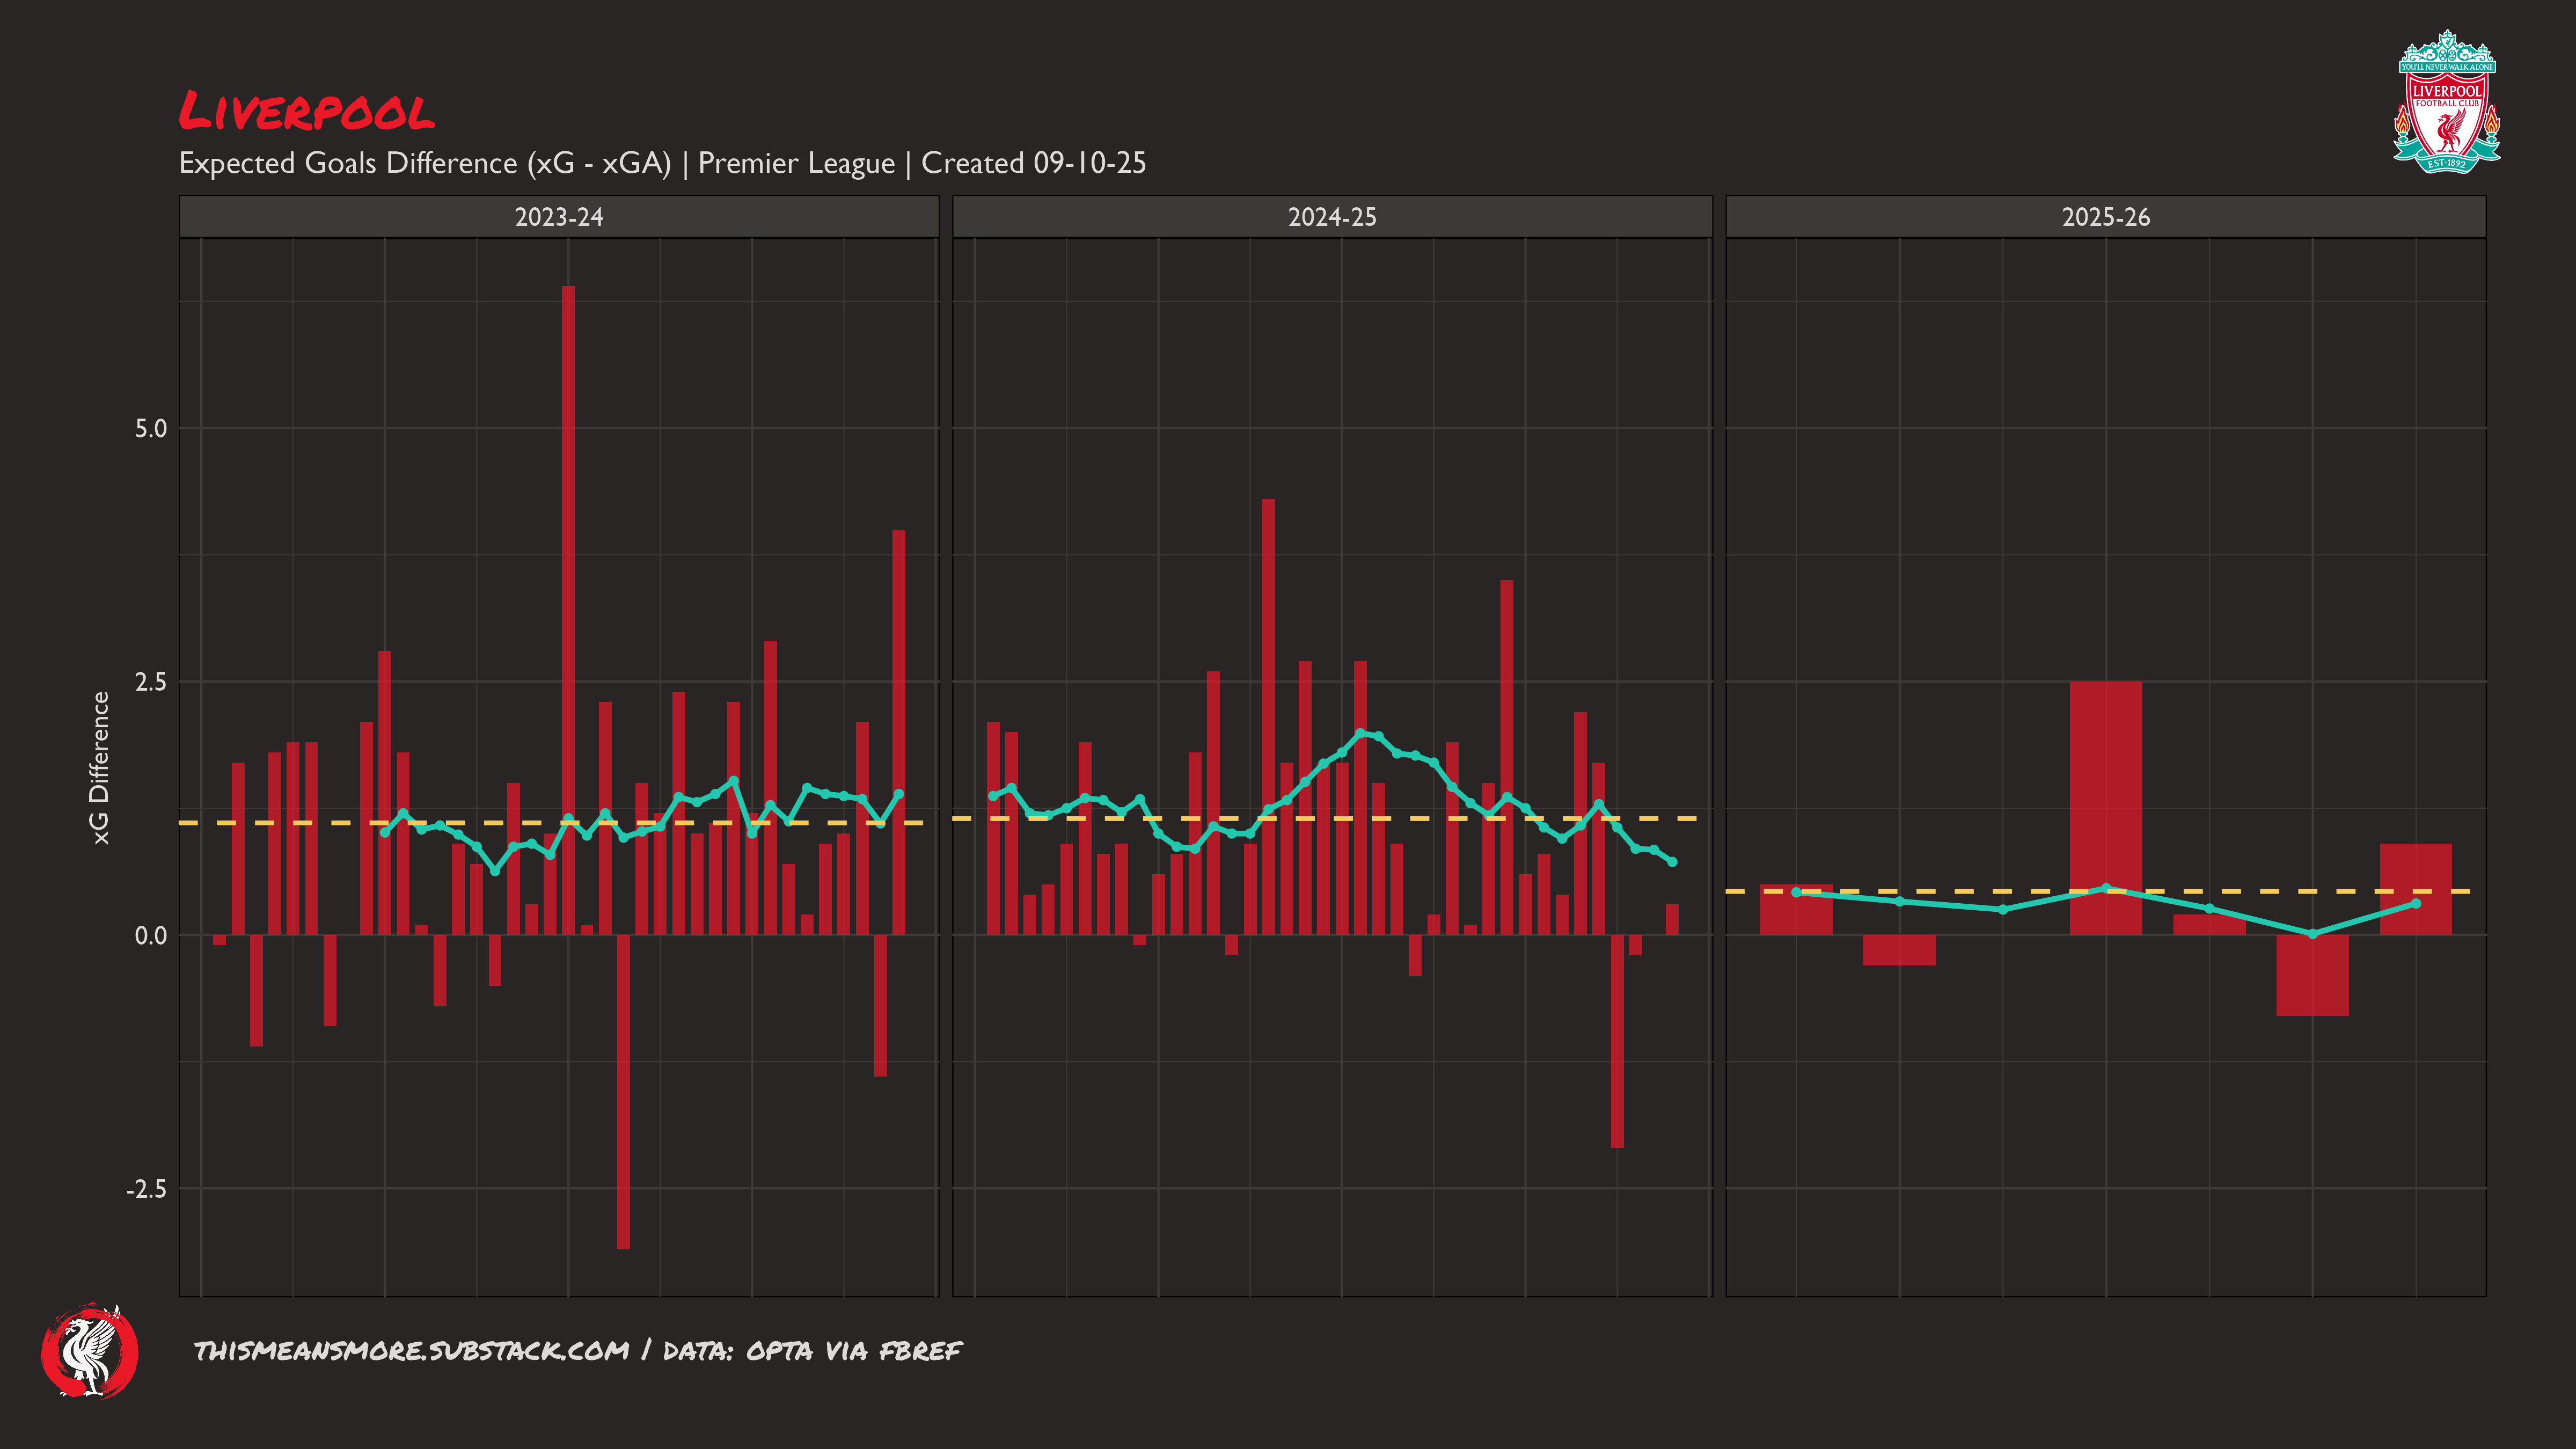
Season mean: 0.43
10-match rolling mean: 0.31
This is more concerning. I think most models consider a team to have ‘won’ a match on xG with a difference of +0.4, so Liverpool are just hanging on here. We would hope for Liverpool to be averaging way above this. Basically, every match Liverpool have been in has been close — they have ridden the tiger mostly, but are in danger of falling off if they do not become a dominant team again.
The fact that his metric is concerning despite neither xG nor xGA being woeful makes me wonder if something is going on with the game states that makes the games close. I am thinking of the recent Chelsea (a). Liverpool were fairly solid for ~15 mins until Moisés Caicedo scored a worldie. If Liverpool had scored first, would the game have been different re: xG(A)?
We will never know, but I would be interested to compare game state data between this season and the last two.
Shooting
The ideal is lots of good shooting opportunities. High quantity, high quality. The preference is quality, but quantity helps.
Quantity
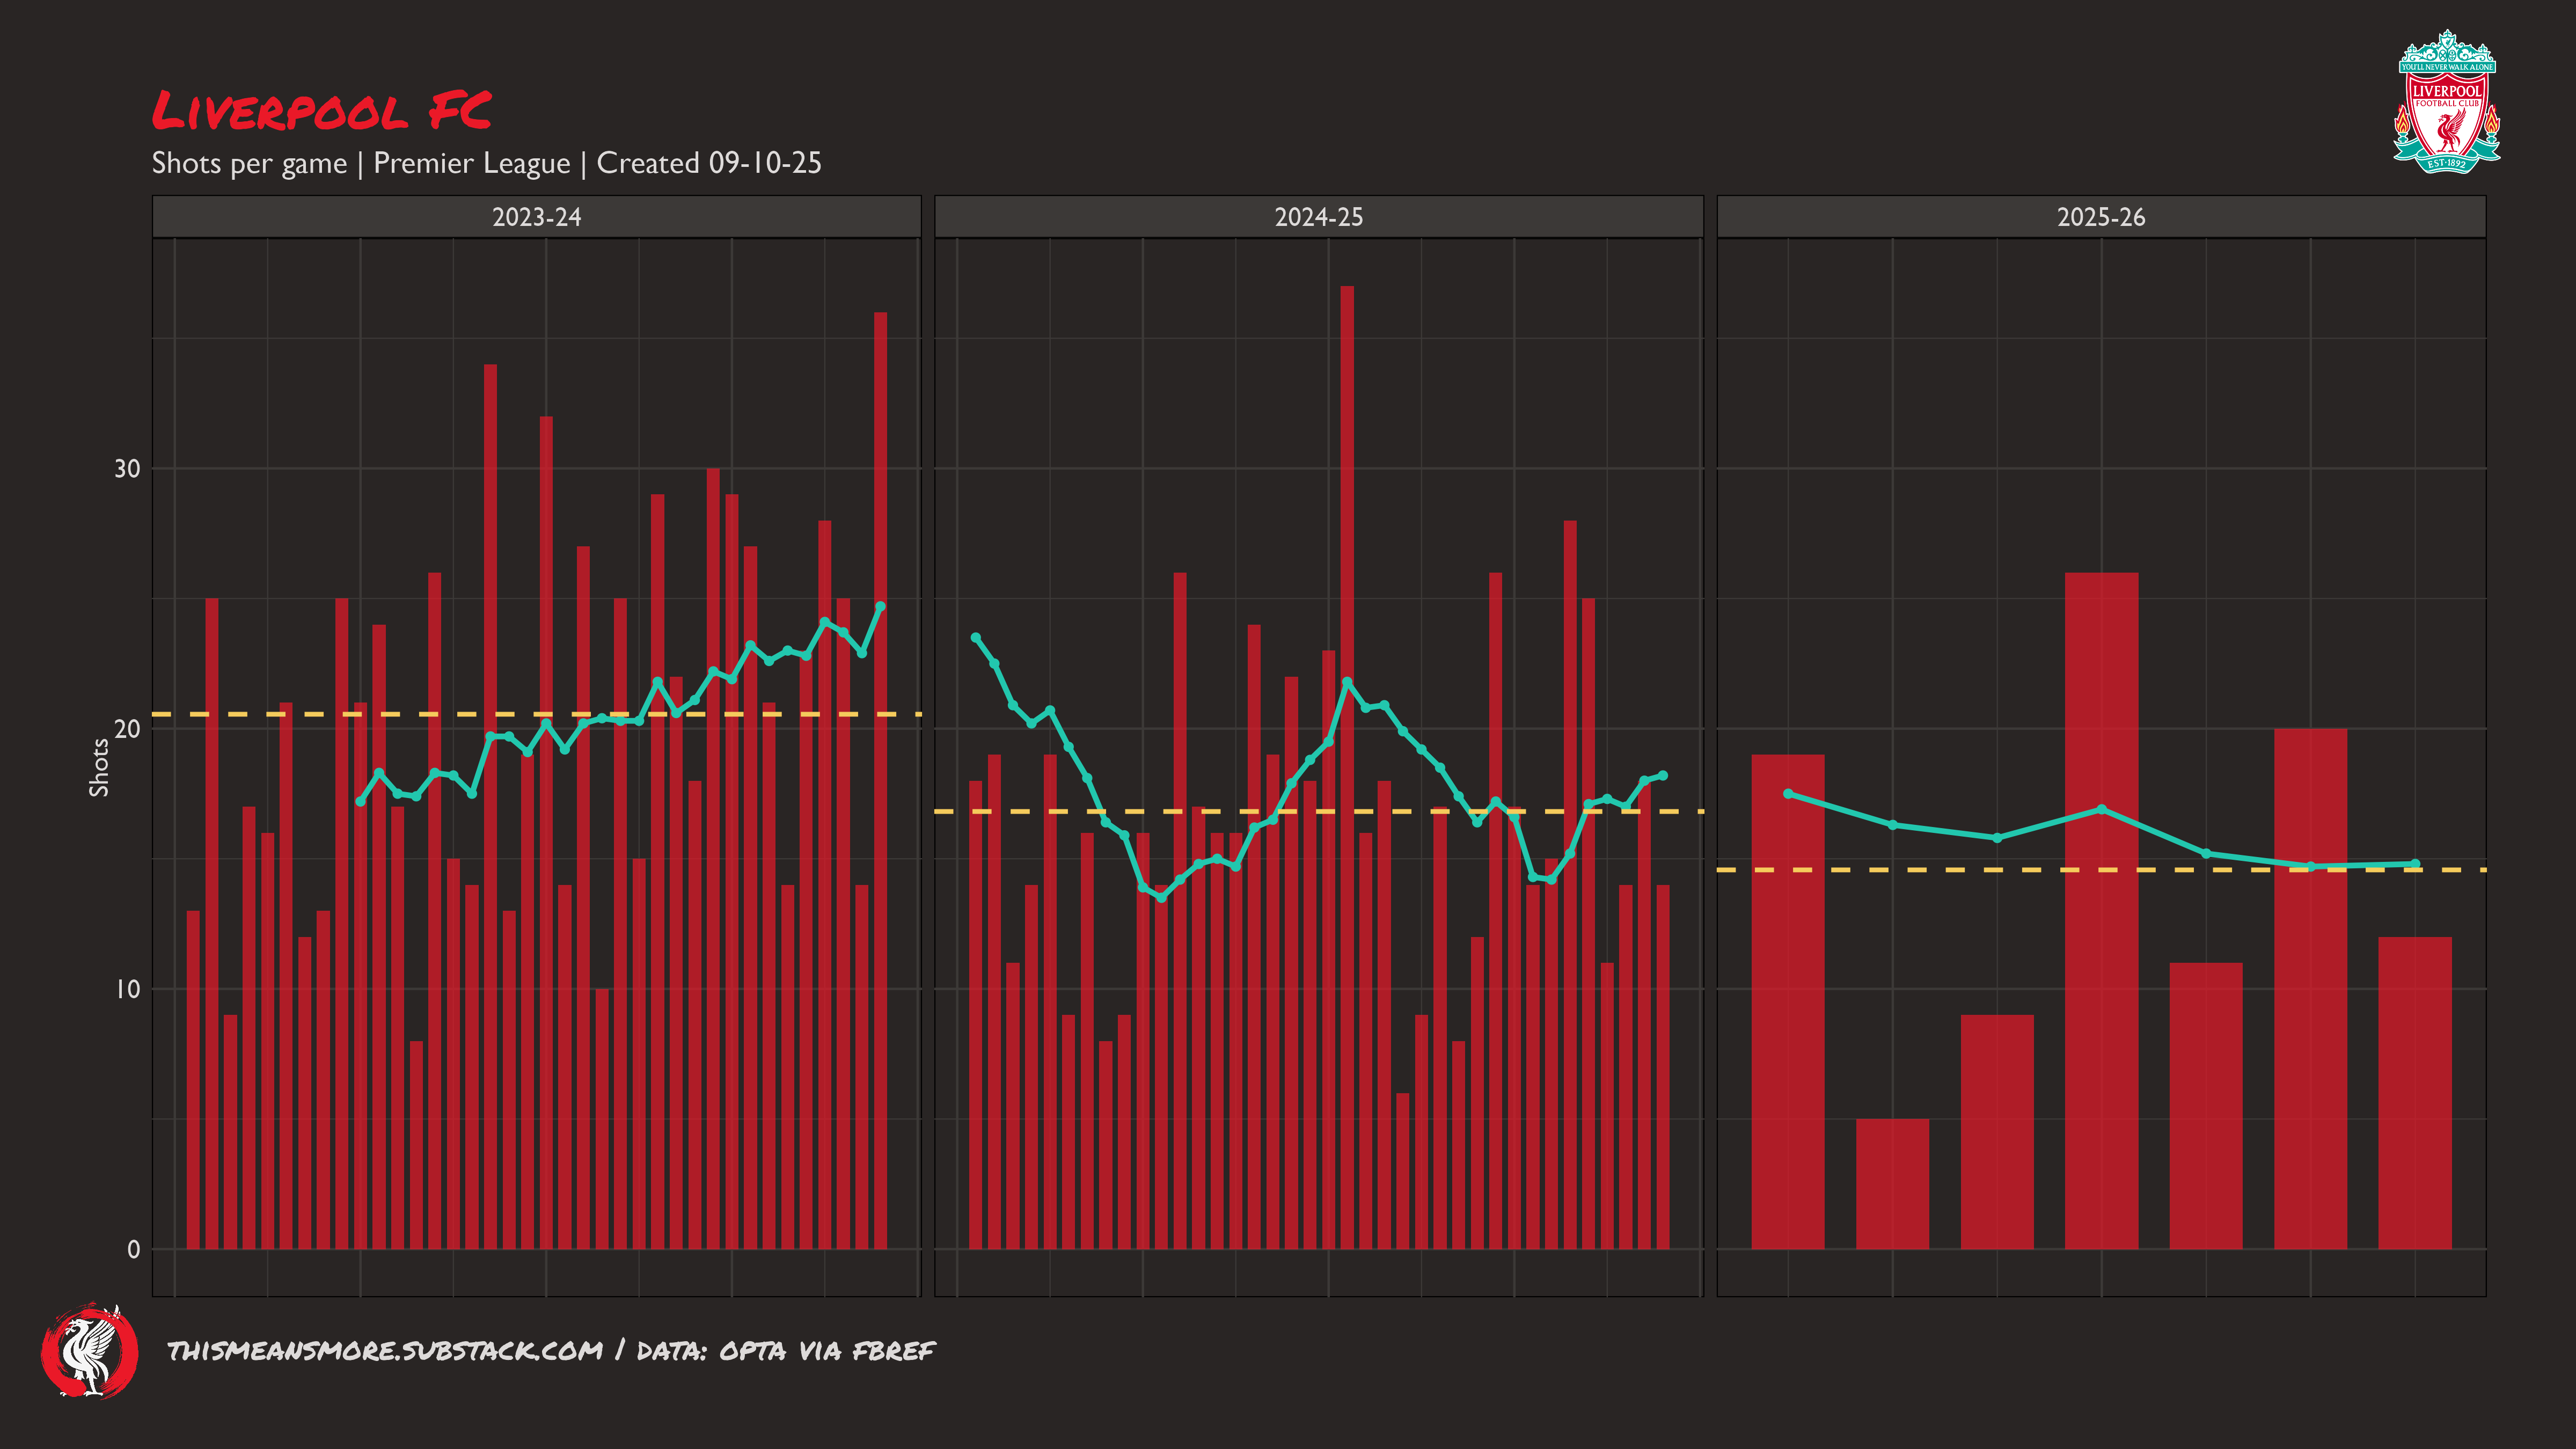
Season mean: 14.6
10-match rolling mean: 14.8
We can see how Klopp’s Liverpool 2.0 were shot machines with 20.6 per game. The change to take fewer shots under Arne Slot (16.8) was not a bad reduction (see below), but the current season (14.6) feels a bit too low. The downward trend is also not likeable.
I would like to see Liverpool take more shots. But of course, we want them to be good shots.
Quality
So, what of the quality of Liverpool’s shots?
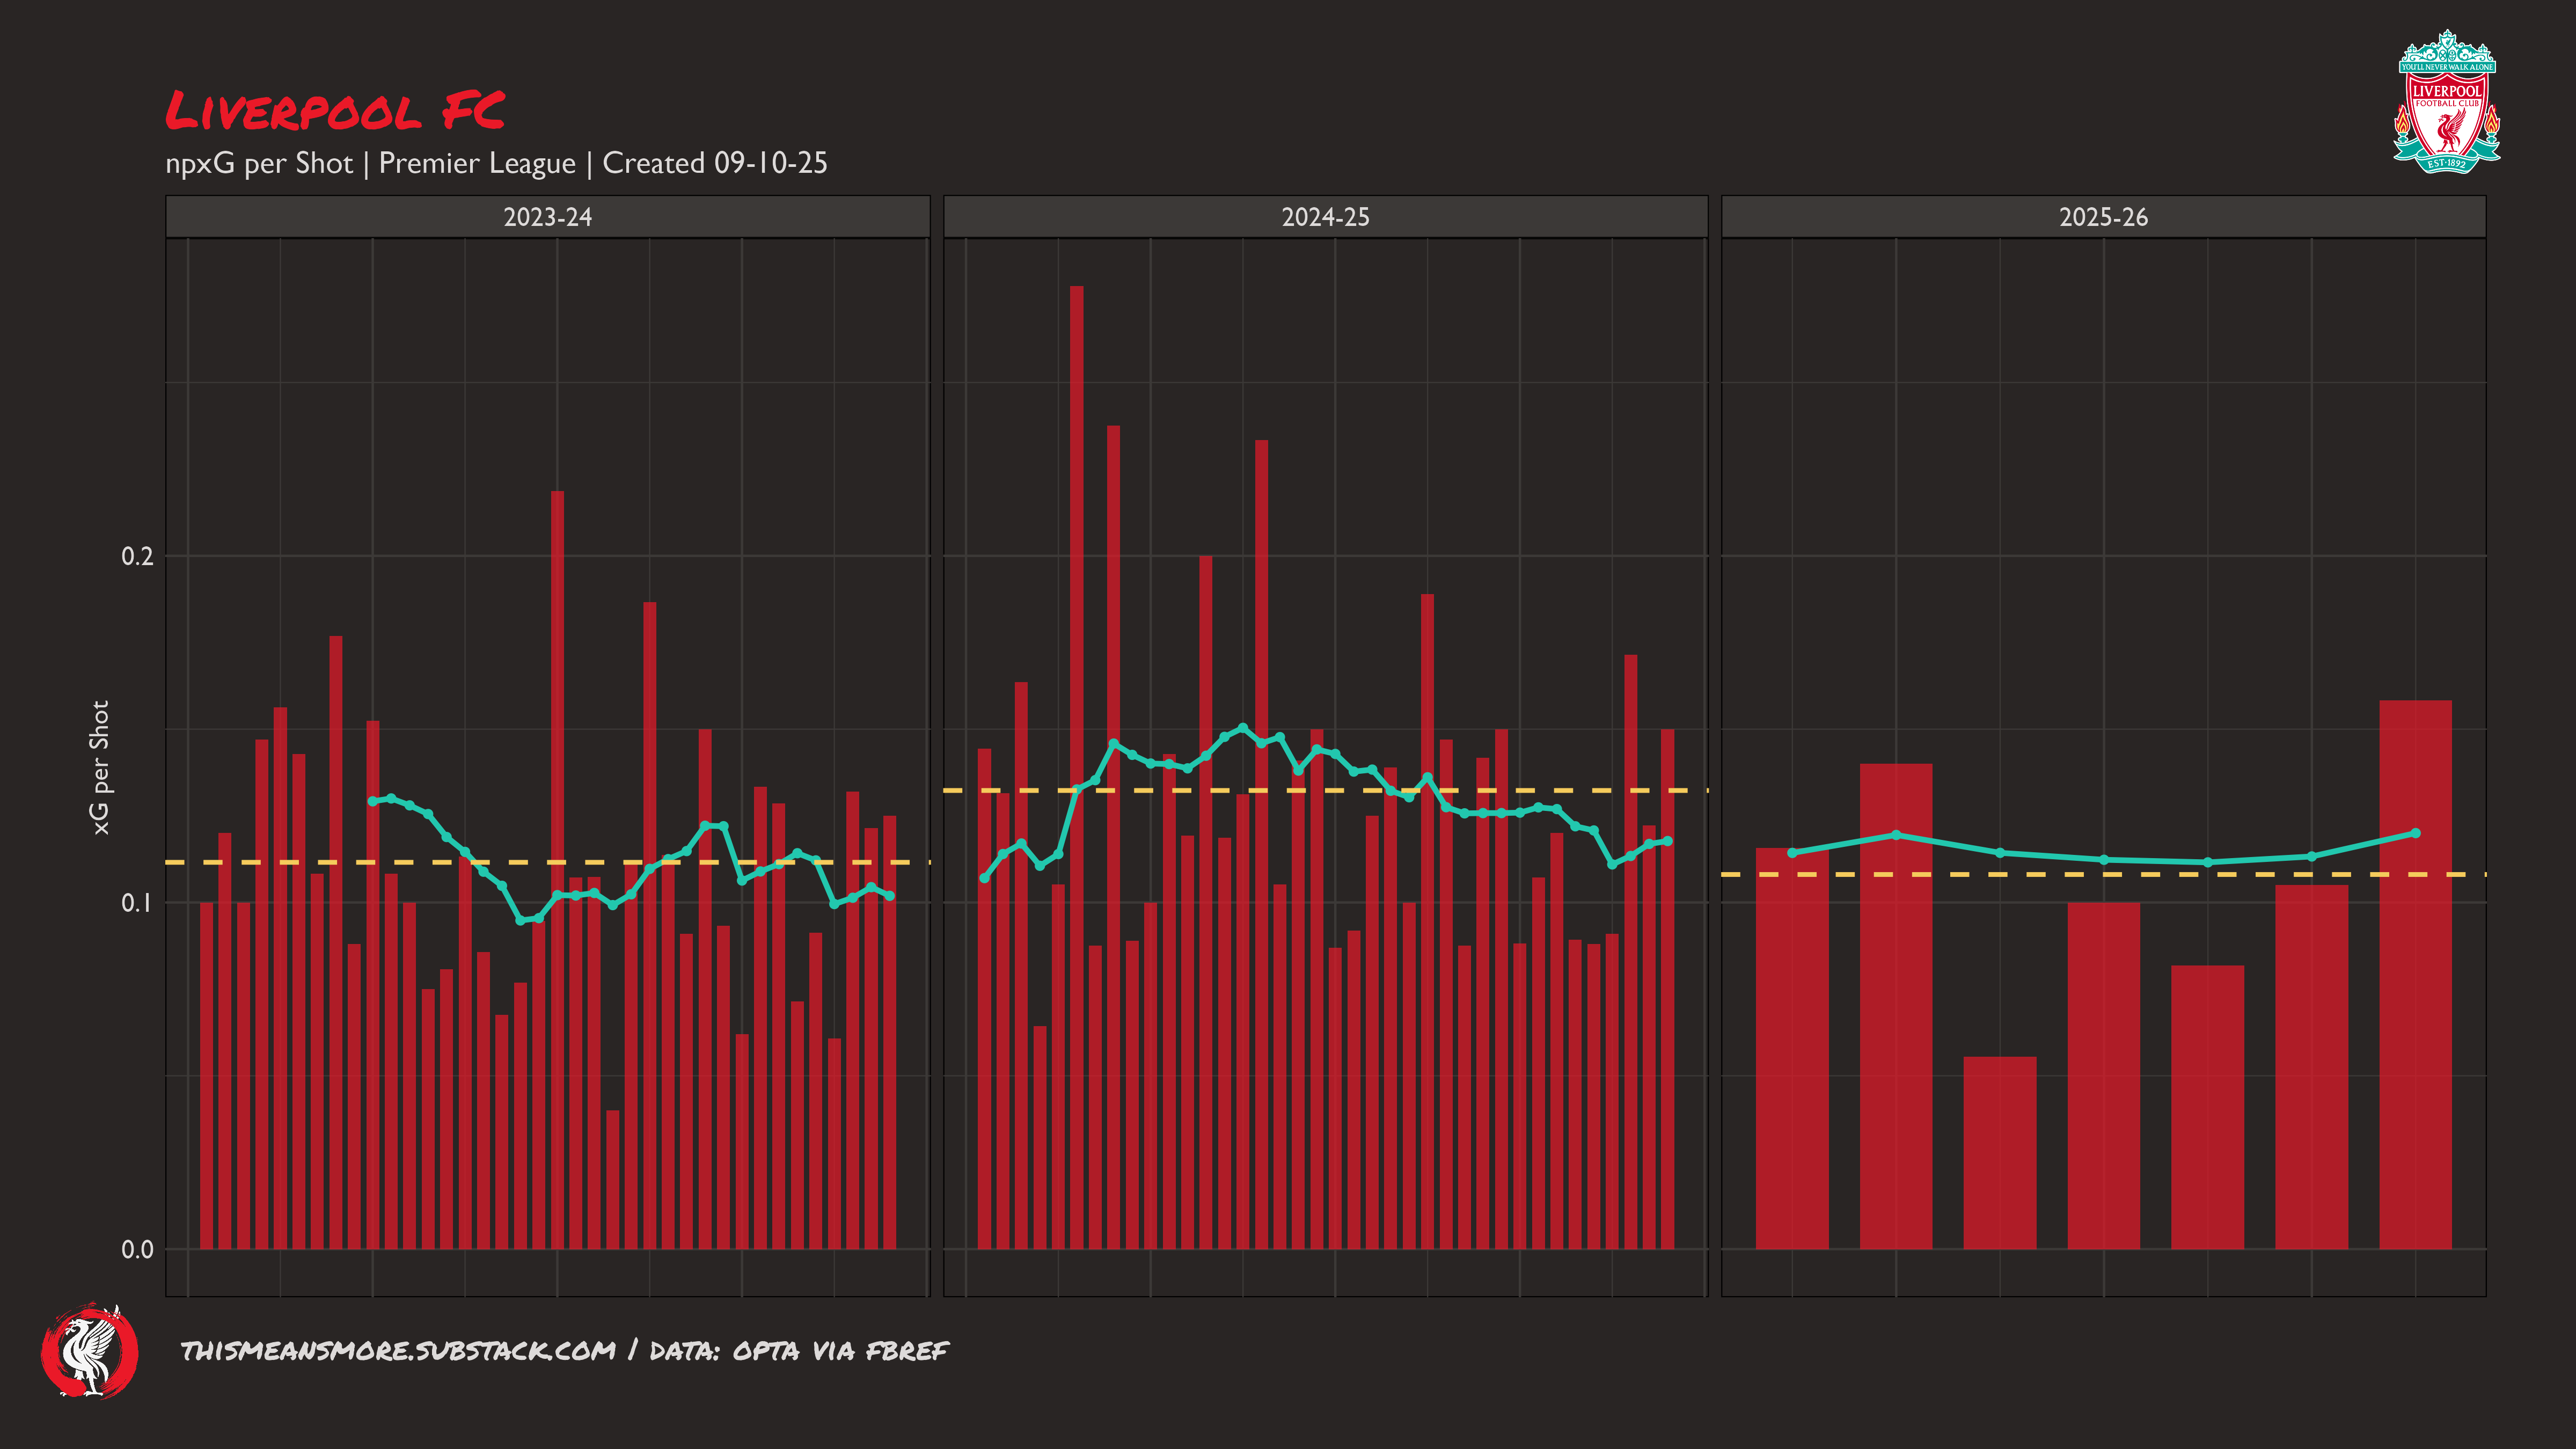
Season mean: 0.104
10-match rolling mean: 0.12
A change in Slot’s first season was increased shot quality, which, on average, is lower this season. This season’s mean (0.104) is now the same as Klopp’s last season (0.103), having been 0.119 last season.
These are small margins, but margins can matter.
The rolling mean is at this level, and trending upwards, which is encouraging.
In the Premier League context
How is Liverpool’s shot quantity and quality compared to the league?
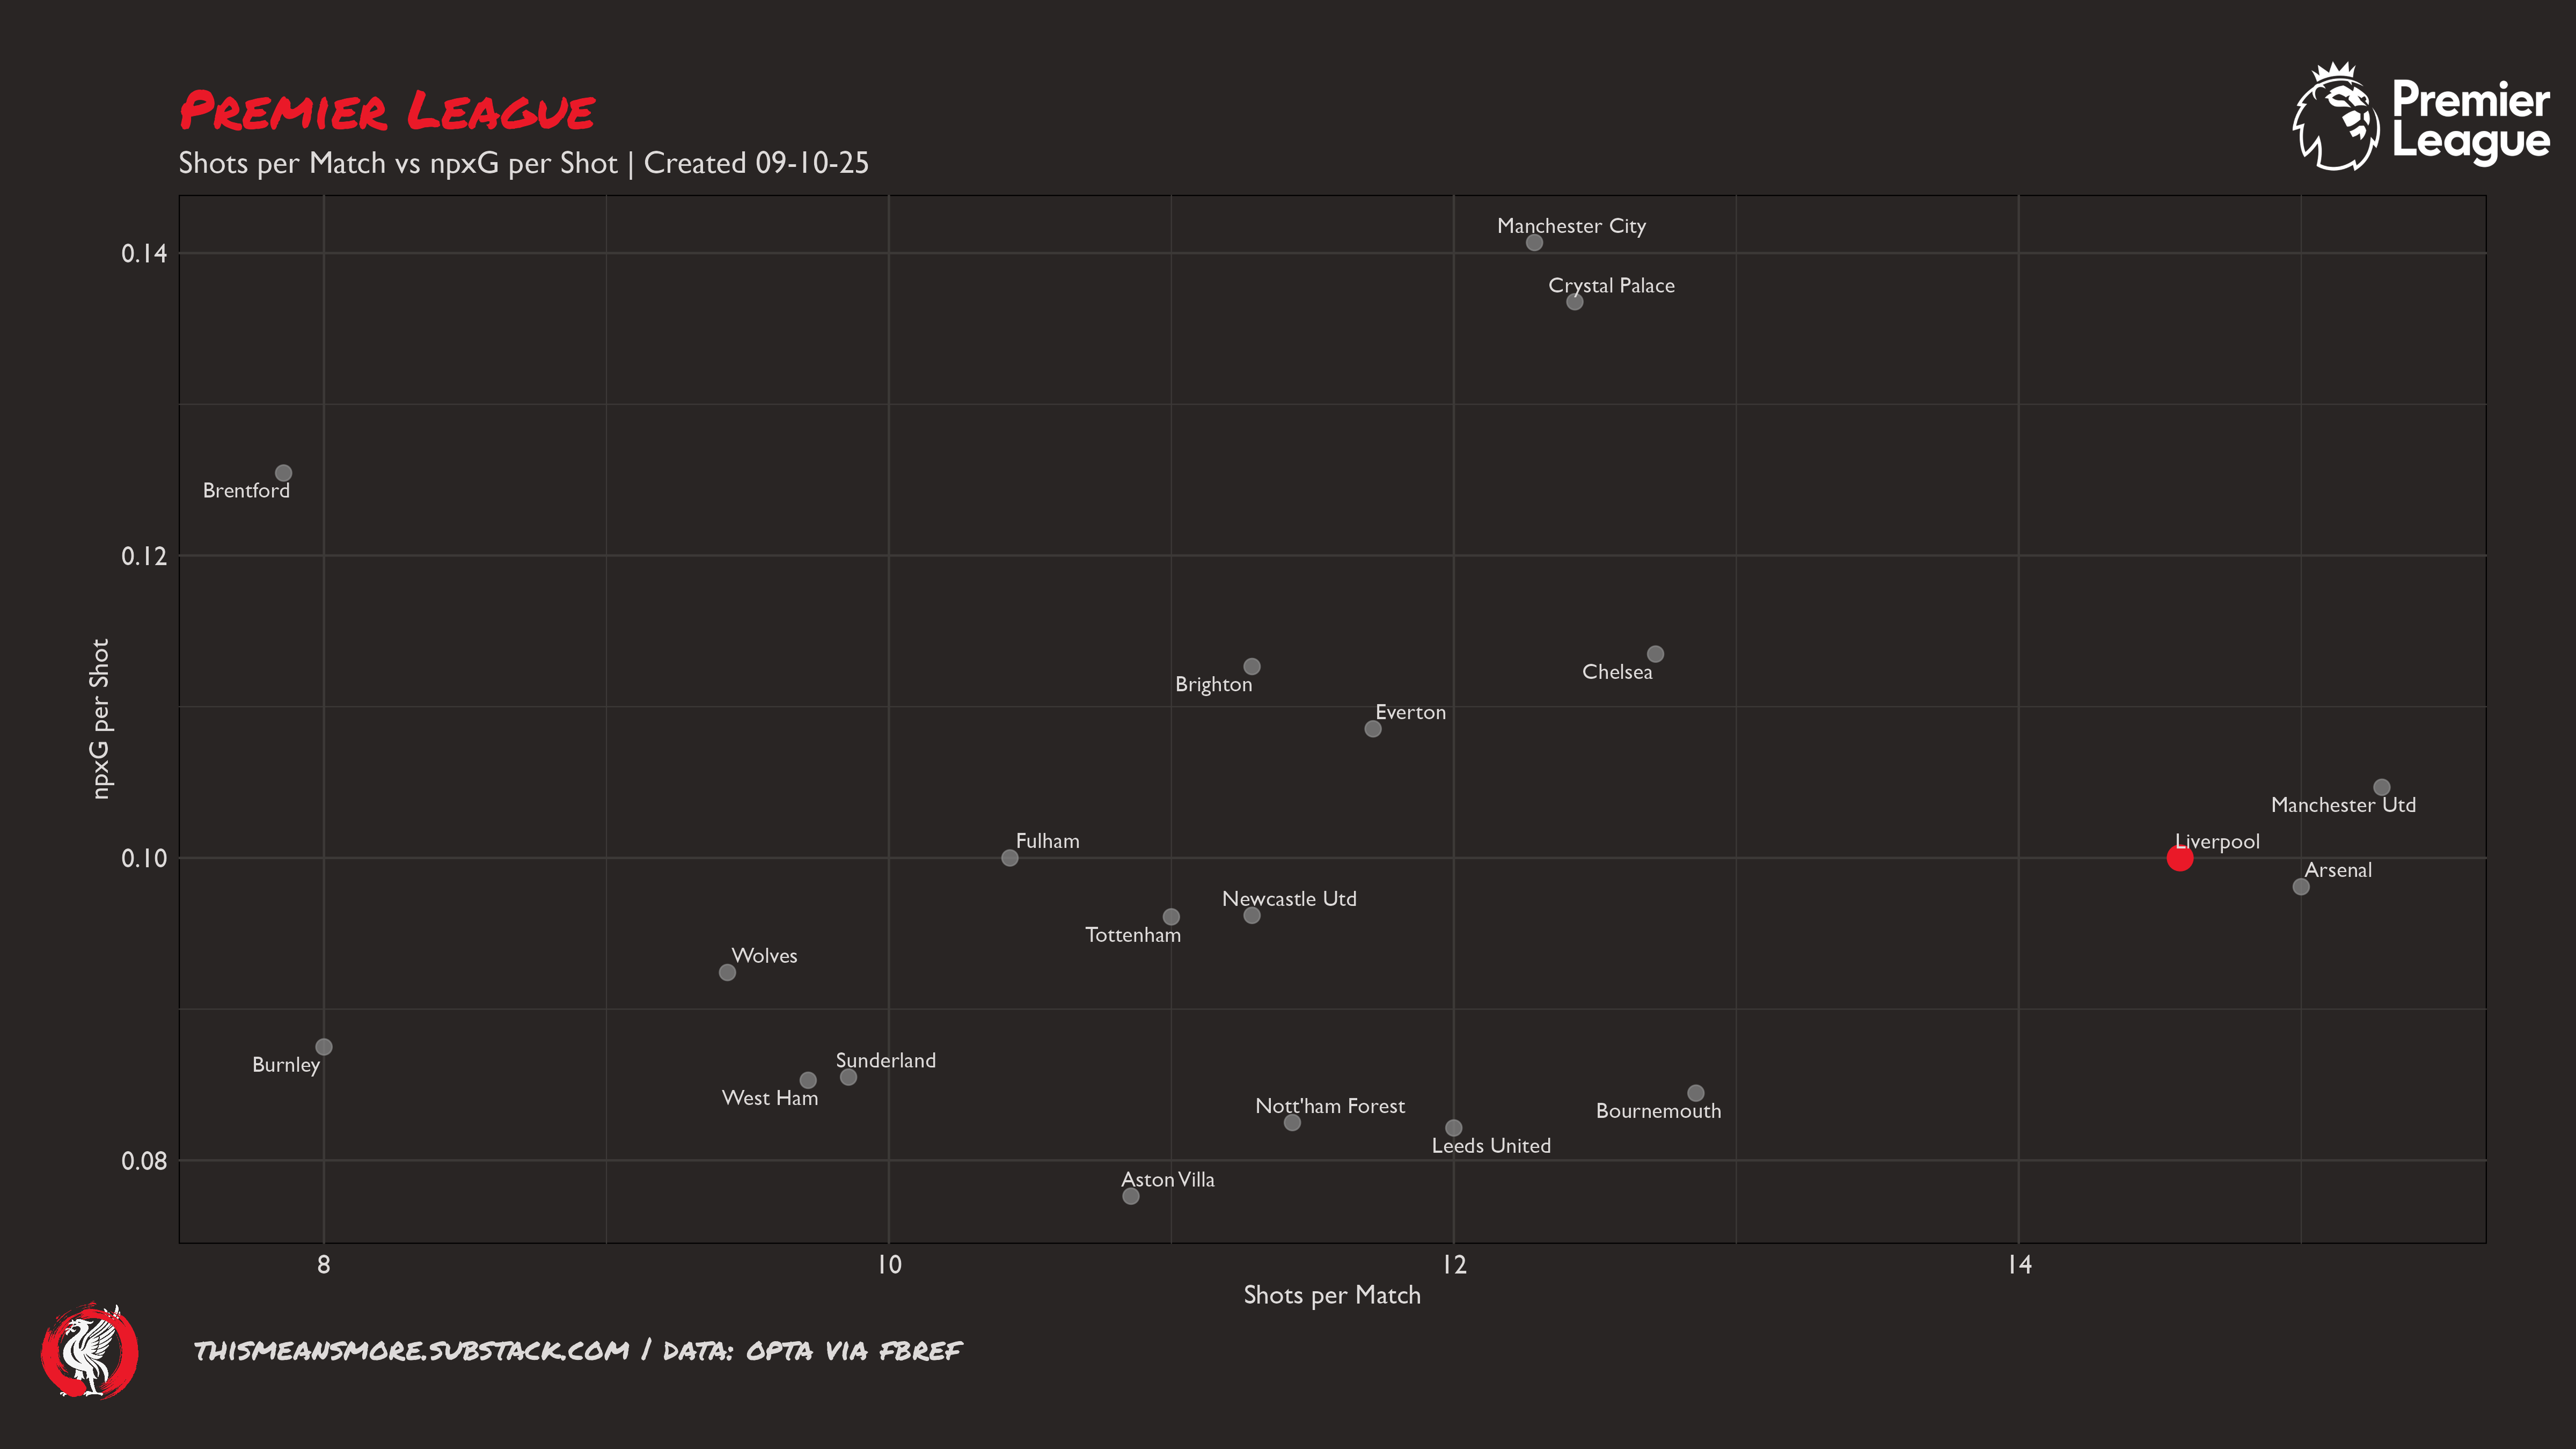
Looking at this data makes me think improving shot quality is the priority. There is a nice empty patch in the top-right corner that Liverpool could make their own.
Manchester City and Crystal Palace are impressive for quality, but Liverpool are hanging with the Arsenal here, so Liverpool are not disastrous.
There are so many metrics we could look at like this, but I think are some basic important ones. This is a basic beginning. Future iterations will be bigger and badder. This one is free; those will be mostly paywalled (writing code takes time and effort). Let me know if there are any others you would like to see visualised and I will see if I can make them.